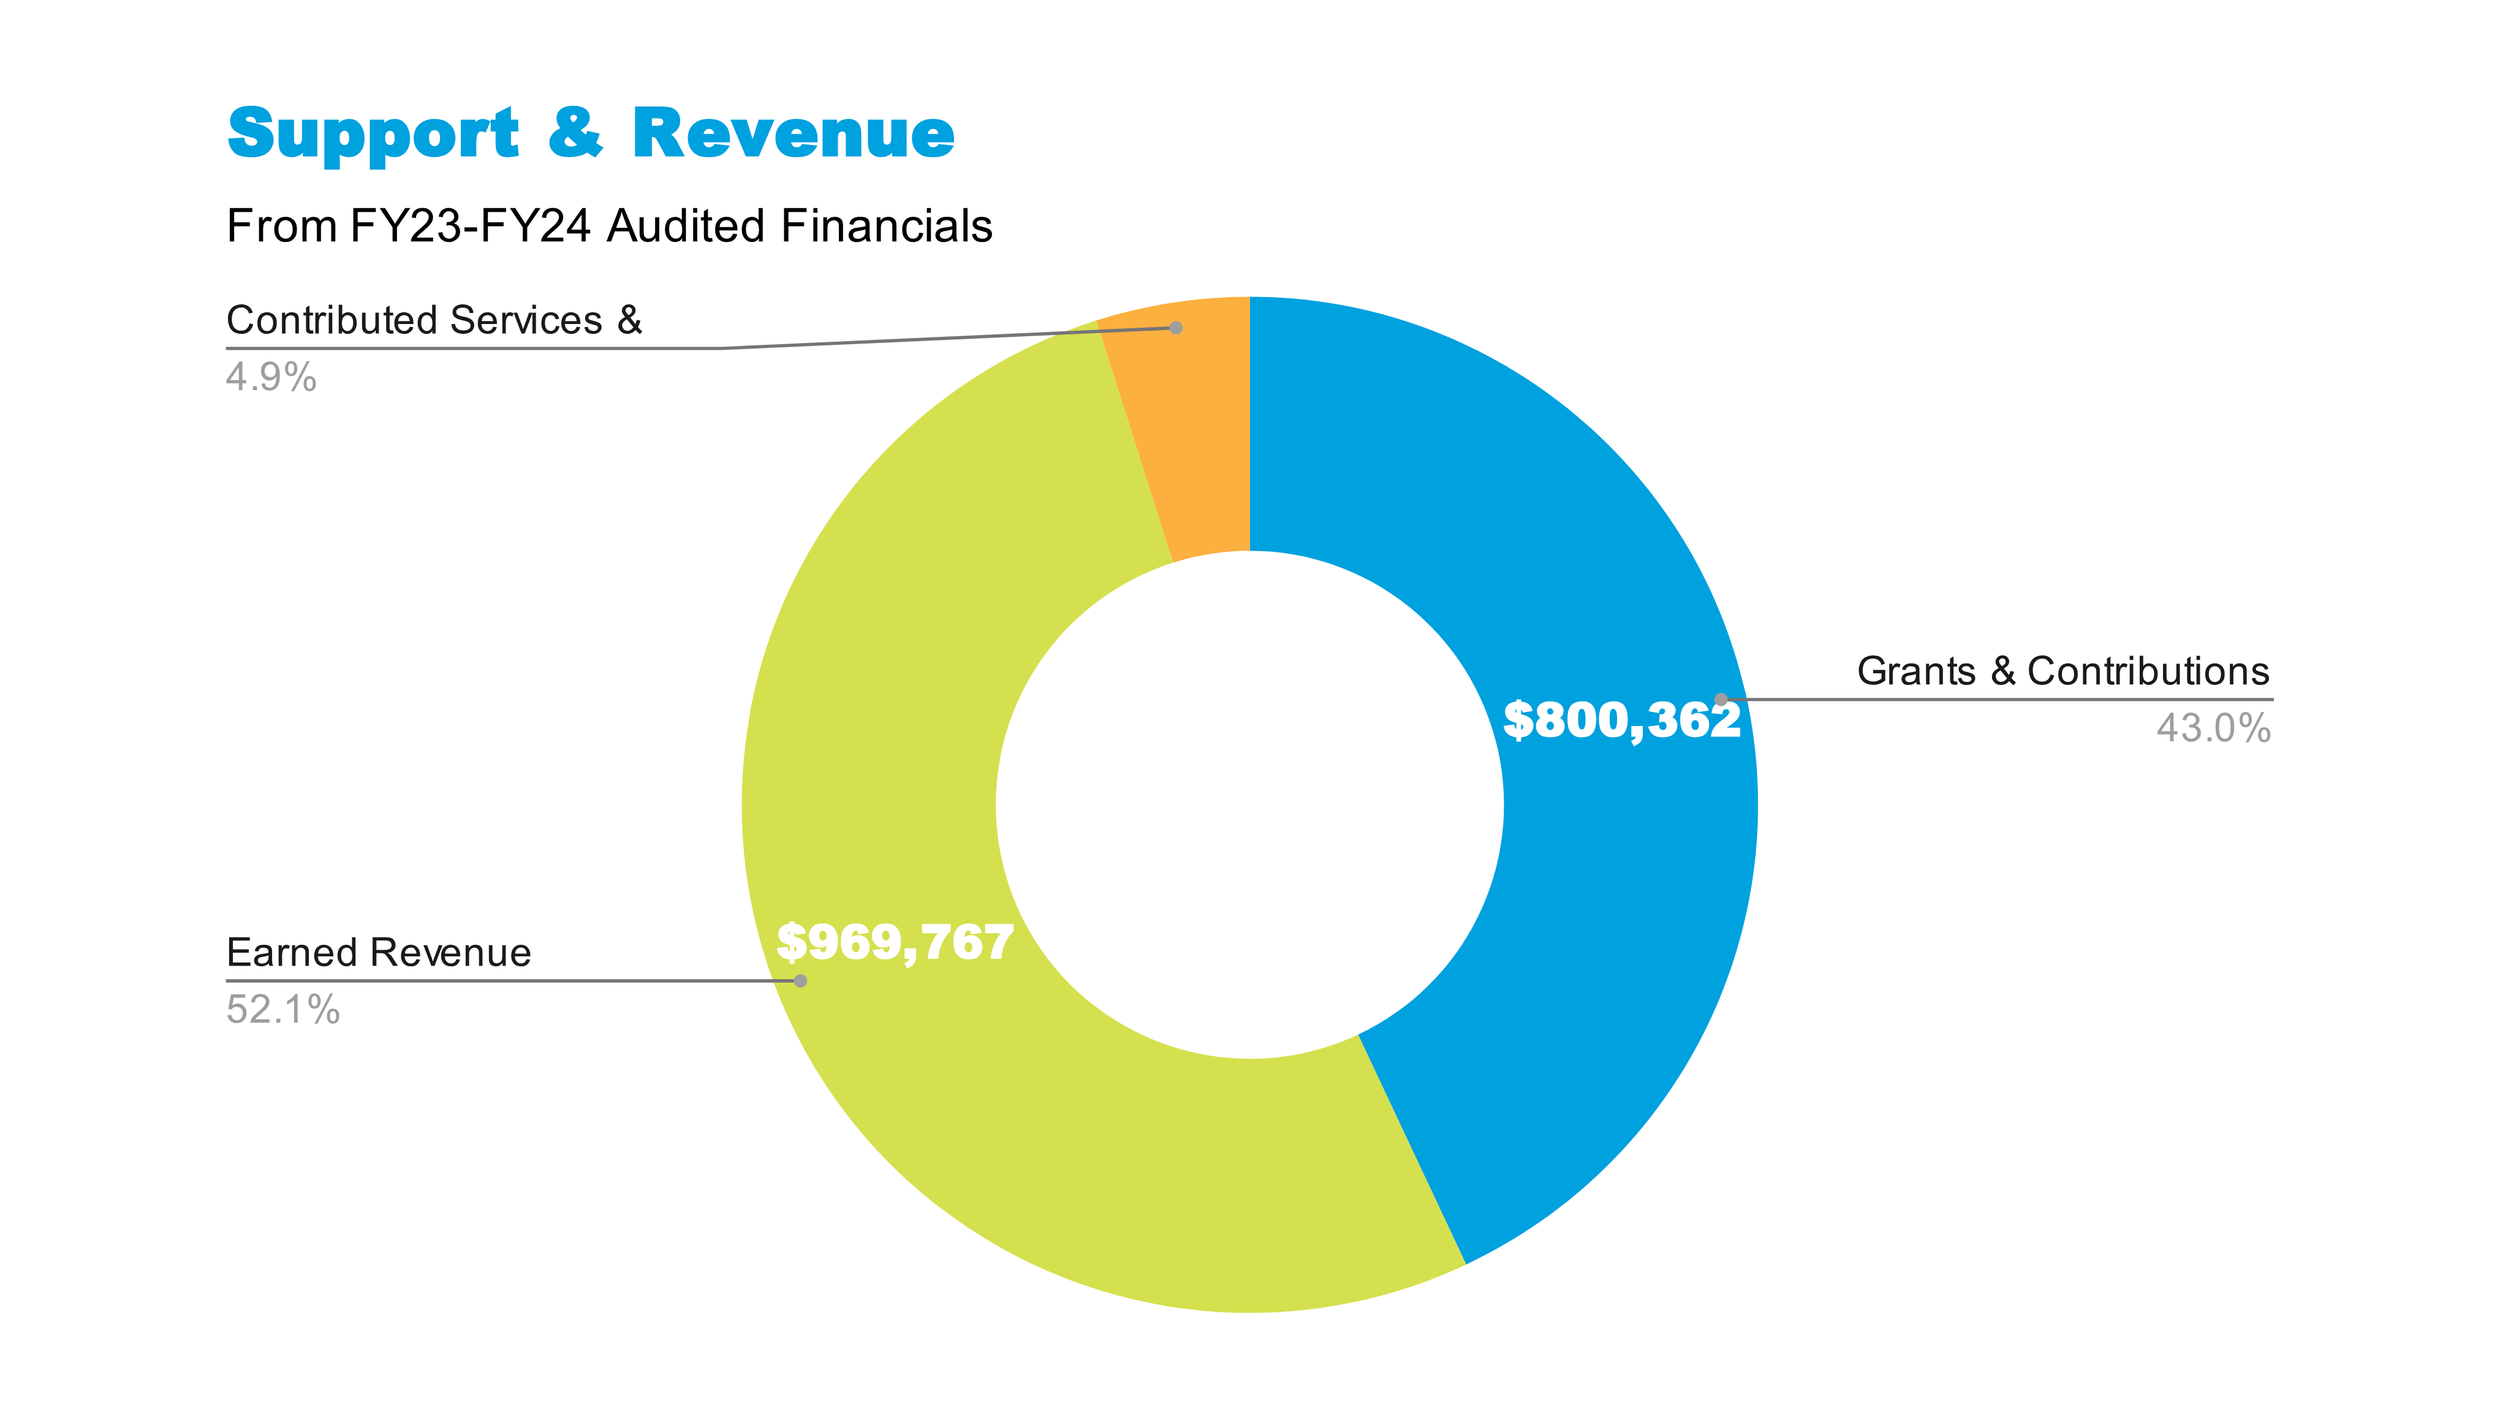
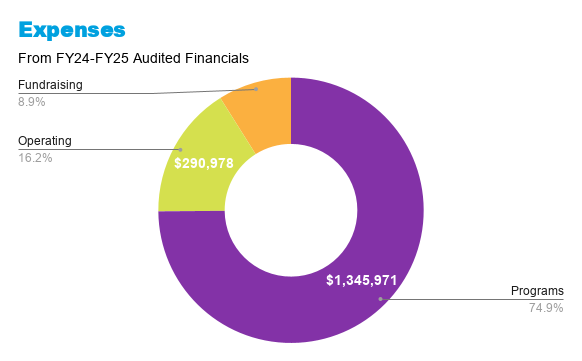
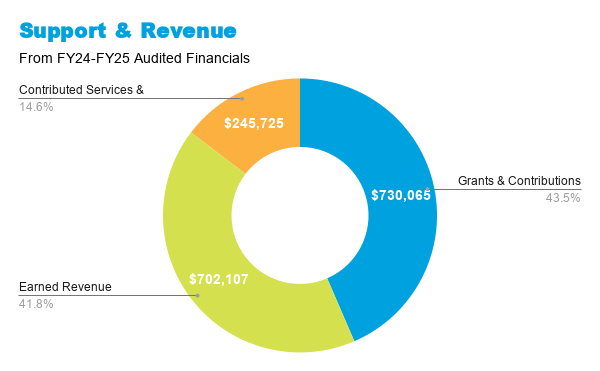
FINANCIAL INFORMATION

Pie chart showing expenses from FY22-FY23 audited financials with categories and dollar amounts: fundraising $291,910, operating $294,920, programs with the largest portion, unclear exact amount.
Financial data chart showing programs with total amount of $1,541,171, operating costs of $294,920, and fundraising of $291,910.
Pie chart showing expenses from fiscal year 2023 to 2024, divided into three categories: programs, operating, and fundraising, with detailed dollar amounts and percentage labels.
Financial report showing total programs funding of $1,539,182, operating expenses of $277,467, and fundraising of $215,825.
Pie chart showing support and revenue from FY22-FY23 audited financials, with sections labeled earned revenue, grants and contributions, and contributed services.
Financial summary showing grants and contributions of $862,052, earned revenue of $934,025, and contributed services and supplies of $15,354.

Pie chart showing support and revenue sources from FY23 to FY24 audited financials, with segments for earned revenue totaling $969,767 and grants and contributions totaling $800,362.
Financial report showing grants and contributions of $800,362, earned revenue of $969,767, and contributed services and supplies of $91,067.

2023-2024 Annual Report

Click the image to view >

Past Annual Reports

2022-2023